Hi All,
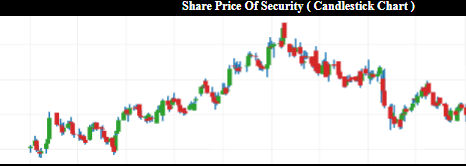
In this article I am going to plot a candlestick chart in tableau . A candlestick chart (also called Japanese candlestick chart) is a style of financial chart used to describe price movements of a security, derivative, or currency. Each “candlestick” typically shows one day; so for example a one-month chart may show the 20 trading days as 20 “candlesticks
It represents all four important pieces of information for that day: the open, the close, the high and the low. Being densely packed with information, they tend to represent trading patterns over short periods of time, often a few days or a few trading sessions.
Let get started and create one in tableau .
Step 1: Import the excel file into tableau . The excel file has the values open, high, low, close , Spread High-Low and Spread Close-Open for a stock on a particular date.
Step 2 : In the worksheet tab bring the measures Low Price and Open Price to the Rows shelf. Click on SUM(Open Price) and select dual axis.
Step 3: Go to edit axis for both the measure and uncheck the include zero check box.
Step 4: Select default aggregration as average for both the measures
Step 5 : Under marks select All and then change the default chart type to Gantt Bar.
Step 6 : Click on AVG(Low Price) under marks and place the measure Spread High Low in the size . Click on size and reduce it to minimal.
Step 7 : Click on AVG(Open Price) under marks and place the measure Spread Close-Open in the size . Click on size and set it to be thickker.
Step 8: Bring the date into filter box . Select Relative Date > Range Of dates > Ok.
Step 9: Show quick filter for date.
Step 10 : Bring the Dimension date to the Column and then select Day from the dropdown.
Step 11: Create a calculated field For Colour : [Spread Close-Open]>0 to change the colour of the bars .
Step 11: Under the marks card Select AVG(Open Price) and place the created dimension For Colour in the Colours tab. Change the colour of False as Red and True as Green.
Your candle stick chart is ready . You can change the dates now from the filter and the candles will realign automatically.
Comments are appreciated.
Thanks.
Rahul


