
We have seen multiple use cases of Parameter actions in Tableau in our last blogs. In this blog post we will look into another useful trick of calculating YoY and using parameter actions to compute YoY dynamically.
Before we employ parameter action for this we will first understand what is YoY and how do we calculate it.
To calculate YoY change we need two things :
1- Current Year to date
2-Last Year to Date
Year to date refers to the period of time from the beginning of the year to the current day ie today. Current year to date refers to the time period of the current year and Last year to date refers to the same time period but in the previous year. YoY is defined as the changes Current year to date with respect to previous year to date.
Lets calculate them one by one using Datediff and Dateadd functions and using them to calculate YoY by following steps.
Step 1: Import the global super store data in Tableau.
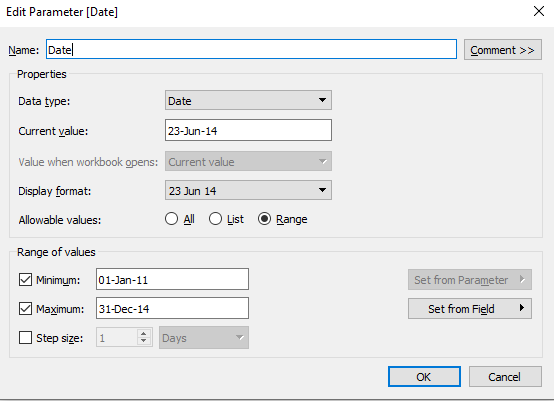
Step 2 :Create a date parameter which would let you select the date till which you want to calculate the YoY.
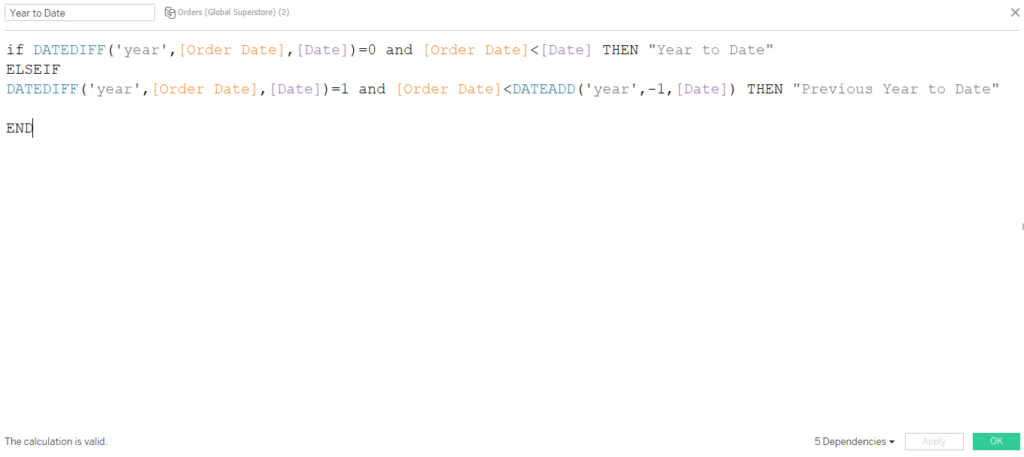
Step 3: Create a calculated feild that differentiates the dates in Year to Date and Previous year to date as under
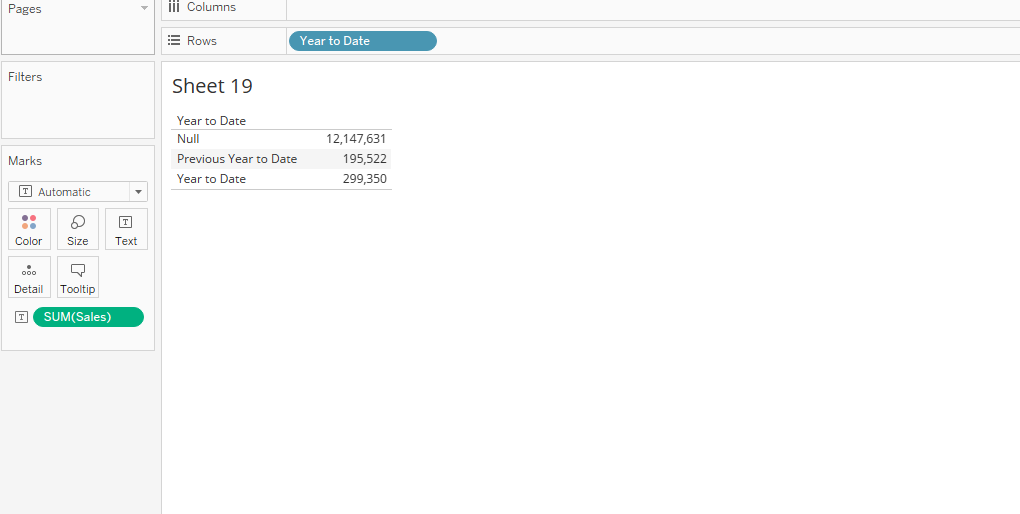
Step 4: To check if our created field is working , go to a new sheet and right click on the Date parameter that we created >> show parameter control to display the Date parameter on the worksheet.
Bring the calculated field Year to date to the Rows and Sales on to the text mark . Select any value of date on the parameter and you will see the sales for Previous year to date and Current year to date appearing.
Step 6 : Calculate YoY as under:
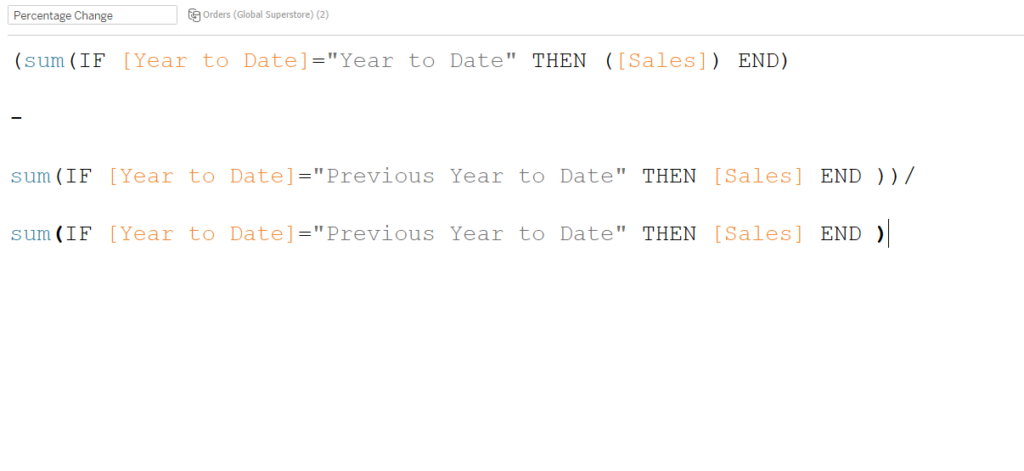
That’s it , we have now created a calculation that would show the year over year (YoY) change with respect to the date selected.
The Challenge
Here is the ask for all of you who who have been reading my blogs about using parameter actions. Create a trend chart for two year using the datasource used in the tutorial. Use parameter actions to drive the YoY calculation and also display Current Year to Date , Last year to date and YoY change along with the trend chart in a dashboard. To add another level to the challenge try creating a reference band that shows the areas under comparison. Here is the interactive version of the problem statement.
Hope you guys enjoyed this post about YoY calculations. Ping me back on my email id ([email protected]) in case if you have any difficultly in working out the challenge part.
Happy Learning!