
In this article under Tableau Tips we will see how to highlight the data that is between two dates. Let us suppose we have the sales across years from our sample superstore data and we would like to highlight the sales that falls under a certain date range which is dynamic and can be chosen by the user .
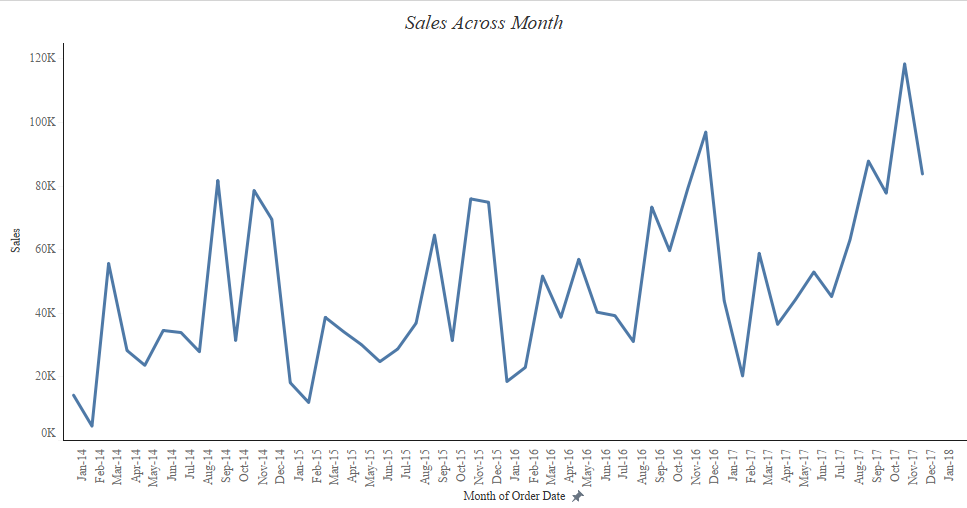
To start lets first plot the sales across months from our superstore data.
Drag Sales to rows and Order date to the columns . Right click on the Order date in the columns and select month which appears second in the dropdown. Your worksheet will look like this now :
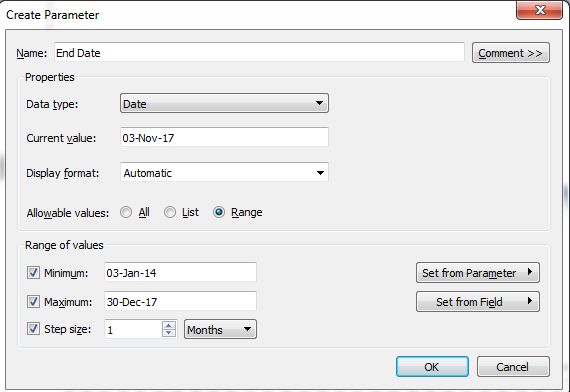
Create a date parameter Start date, select the allowable values as range and in the range of values Select set from field >> Order Date. Check the box for Step size and make it to 1 month.

Similarly create a parameter for the end date>
Once both the parameters are created , go to the analytics pane and drag Reference band to the worksheet , Add the reference band to the Month across the whole table
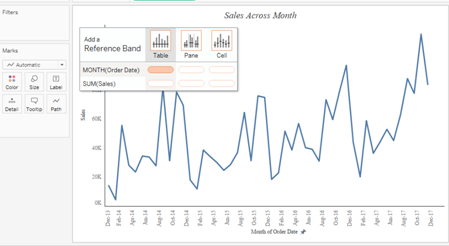
In the pop up box that appears, select Start Date in value under the option Band From. In the option for Band To select End Date from the dropdown. Chose a color to be filled in the band under the formatting area.

Once done right click on the Parameters end date and start date and select show parameter control. Toggle between the dates and you can see the area between the dates getting highlighted.
Here’s the workbook for your reference.
Feel free to mention in the comment in case if you are not able to get it.