
Hi All,
First of all a happy new to all of you and may this new year bring on a lot of learning for you. This is my first post in the new year and in this post we will discuss how to use a parameter as a common filter for two data source. For this we will be using the following data source : Sample – Superstore and the Coffechain data that is provided by Tableau. Both of these data have a common field State. What we would like to achieve is that we have a common filter for state that applies to both the workbooks ( sample super store and coffee chain) so that we can filter the view simultaneously for both the dataset on the dashboard.
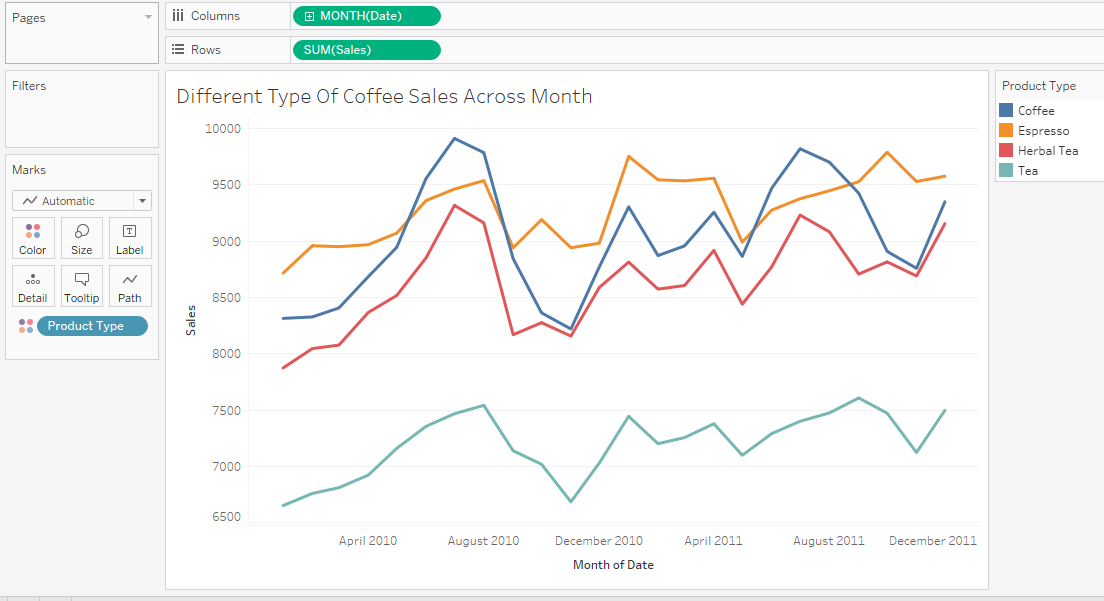
Let go ahead and load our Sample Coffee Chain data. Once we have the data loaded, lets create a simple view that shows us the monthly sales of the different types of coffee. To do that drag the date field to the Columns and select month year from the dropdown. Drag the measure sales to the rows and bring the dimension product type to colors mark. Your view will now look as under :
Next lets connect the Sample super store data and try to build up a view from it. To do that click on the Data tab at the top left corner of Tableau and from the dropdown select New data source. Add your Global Super Store data and drag the orders sheet to the pane in data source. Now add a worksheet and create a view for the category sales across the years using this data. To do this drag Order Date to the Columns , select Month year from the dropdown and bring the sales measure to the Rows. Next add category to the colors mark. Your view will now be as under :

So we now have views from two diferent data sources (Coffer Data in sheet 1 and Super store data in sheet 2) . Our aim now is to bring these two views in the dashboard and have a common filter of States that applies to both these view.
To do this we need to create a parameter for Selection of States. Click on create parameter . Name it as Select State. Under the properties select String and in the Allowable values click on list. Click on add from field , select any data source and in the dropdwon select State. Your parameter will now have all the allowable values for States.

Next under the Data pane select the coffee dataset , go to sheet 1 and create a calculated field as under :

Bring this calculated field to the filters mark and select true.
Do the same thing for the Super store data ie create a calculated field called select state and bring it to the filters mark and then select true.
Now bring both of these sheets to a dashboard and in the dashboard under Analysis tab click on parameter and then select the state parameter to bring it to the dashboard.
Select the state from the parameter and you will see the view would change for the two worksheets accordindgly.
Here is the workbook for reference:
Hope you guys enjoyed the post!!