
Hi All,
Today in this blog I will try to explain about LOD calculations in Tableau and discuss a couple of scenarios where a LOD could be helpful using the different types of LOD expression that Tableau offers. I have tries to make it as simple as possible and hope this article would be a kick start to your LOD’s calculation in tableau.
To start with LOD’s stand for Level Of Details . These were introduced in Tableau from version 9 . The main purpose of LOD is to simplify and extend Tableau’s calculation by addressing level of detail question directly.
At a very broad level consider using a LOD when :
1- There is a requirement to show the data at a different level from the dimension level present in the view.
2-There is a need to obtain some static calculated value that is not affected by any filter that is applied to the view.
Before we get into it directly lets try to understand what we mean by view in tableau by the following three screenshots:

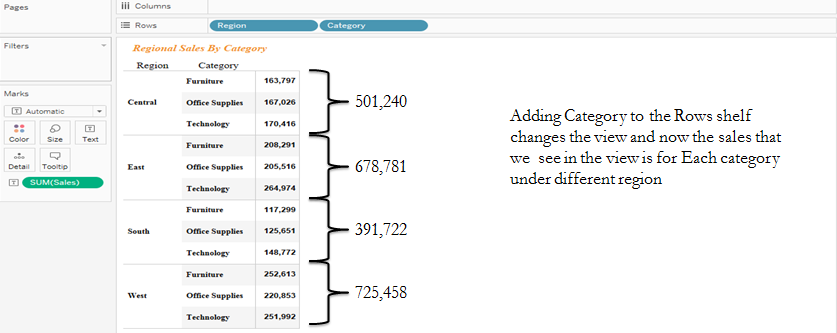

The granularity of the view would change if we add or remove dimension to our analysis. Often we encounter situation were we need to analyse our data from a different granularity from what is in a view. For example say calculating the average oder size per customer. To do this we will have to group all the order size by customers and then take a average of it . An order can further contain different products .
To achieve these kind of scenarios we use the Level Of Detail Expression in Tableau .
Syntax for a LOD : Every LOD that we use follows a common syntax as under :
{ type of lod [Dimension1] , [Dimension2] ,……. : aggregate(measure) }
Tableau offers three types of LOD calculation which are as under:
Fixed LOD : This expression computes the value using the specified dimensions without reference to any dimension in the view.
Include LOD : This level of detail computes the value using the specified dimension in addition to whatever dimension are in the view.
Exclude LOD : Similar to in Include LOD , the exclude LOD is used when a particular dimension(s) are to be omitted from the calculation , out of the dimensions present in the view.
Now as we have gained some understanding about the Level Of Detail and types of LOD that tableau offers let look into these individually by taking different scenario.
Fixed LOD : Fixed LOD are used when calculations are required to be done at a particular level of detail , irrespective of what is in the view.Let us say we want to see the total sales across country . To do this we would drag the country dimension into Rows and select the measure sales . Now what if we want to see this total sales across the county side by side the sales of the states or across region. If we bring the state/region to the view our value changes . To address this issue we use a fixed LOD expression.
Create a calculated field as under :
Country Sales = { FIXED [Country] : Sum(Sales)}
Now drag states into rows and Sales and Country sales in column. The following screenshot shows how our fixed calculation would look into different view :
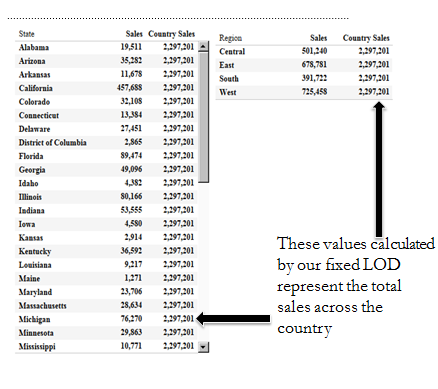
We notice that irrespective of any dimension that is in the view our created measure country sales remains the same. However we see the measure sales to change as the view changes.
Include LOD : The include LOD is used when a particular dimension(s) are to be added to the level of calculation in addition to the dimension present in the view. Lets say we would like to see the average sales across different region. To do this we can simply bring region to the row and selecting the Sales aggregation to Avg instead of Sum. What if we would like to group the sales by states and then see the average sales for states in that region. To do this we use the include LOD as under
Include State : { INCLUDE [State]: Sum(Sales) }
Now drag the Region dimension into Rows and the measures Include State and Sales into column. Change the default aggregation to average. This is what your view should be looking now:

Notice what happens . The avg(sales) just add the sales for that region and divided by the number of record in that region to arrive at the average sales. But our include LOD first groups the sales under each state by region and then takes the average of these. In case of our LOD the denominator would be the number of Sates falling in that specific region.
Exclude LOD : As in the case with include, Exclude LOD expression is used when a particular dimension(s) are to be omitted from the level of calculation, out of the dimension present in view. Consider we would like to see the monthly sales across regions . To do this we can simple drag Region to the column ,month(Order Date) into rows and sales into the text . What if we want to see the total sales across all the regions for all the months. To do this we use a Fixed LOD as under .
Monthly Sales : { EXCLUDE [Region]: SUM([Sales])}
Drag Order date to rows and select Month from the dropdown. Place region on the columns shelf. Place the measures sales and Monthly Sales in the text mark . This is what your screen should look like now:

Here with our Exclude LOD we are able to see our data in two dimension now. Once the monthly sales for regions and other the total monthly sales for that month .
Do let me know if the illustrations were clear and comment if you are not able to follow up anywhere.
References :
1-Tableau Public
2- Evolytics
3- Ryan Sleeper