
In the previous post under Analytics Pane we discussed about the constant line and its use. Today we are going to continue our discussion with the Average lines
To see how a average line work lets build a view using out Sample superstore data.
Drag region and Order Date to columns. Drag sales to rows and bring region to the colors mark. Your view will now be like this: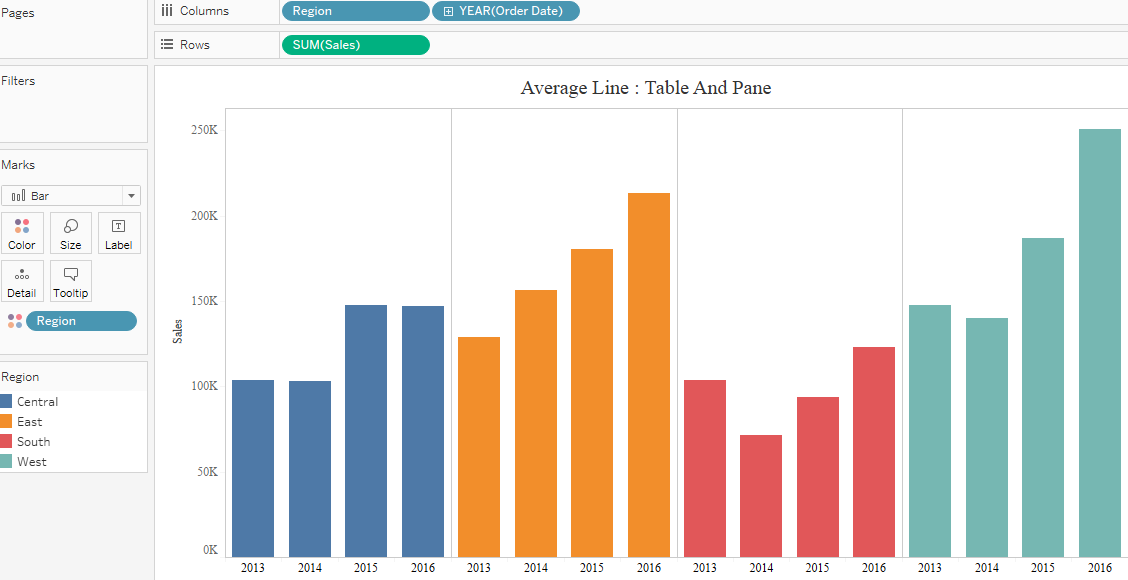
The above view shows the sales across four region for all the year. Lets try adding a Average line to this. When we drag the average line to the worksheet the following screen appears :

We can see three options over here : Table , Pane and Cell. We will discuss the first two ( Table and Pane in this article and the last Cell in the next article.
Drag this average line to the worksheet and place it on ‘Table’ option. We can see that a average line comes across the sheet ( this is average value of all the bar values in the worksheet).

Right click on the average line and we will same options ( Edit , Format and Remove as we saw in Constant line in the earlier post. Select edit and the following window will appear.
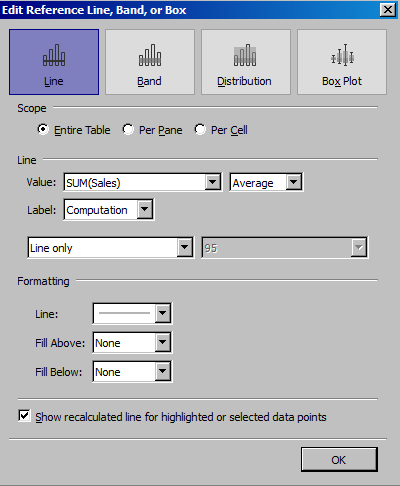
Notice we can change the average line to be applied on Table , Pane and Cell from here as well in the Scope area.
The value of the average can be changed from the Line area. We can change the average value to total , sum , maximum , minimum etc from here.
From the formatting options we can change the format of the average line.

Next lets try to add another average line and this time drop it to the Pane area. We will have the following view now:

Our view has now two average one average for the entire table (Country) and the other for each pane ( Region in our case )
I hope you guys found this article informative.
In the next article I will discuss adding average line with a case study in or next article.