
In this blog we are going to discuss how to create an arc chart in Tableau. Arc charts can be considered as an alternative to bar charts, bars are straight lines and in arc chart we convert them to curved lines, There are multiple version of arc charts that we can create in Tableau. In this we are going to discuss the most basic one.
Let’s get started and try to build the chart step by step.
Step 1 : Load the sample super store data in tableau.
Step 2 : While you are at the data source pane , with the orders selected , copy and paste the following on the canvas.
| Path |
| 1 |
| 181 |
Once you paste this on the canvas you would get an error in the join clause and your view would be somewhat like this:
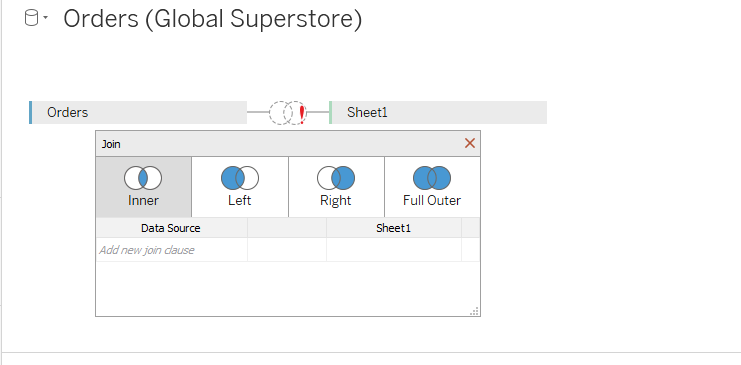
Click on the Add join clause and select the option of Create Join Calculation in the drop down. In the pop up window that open enter the value 1

For the table on the right ( Sheet 1) perform the same step as above and add a join clause with the join calculation as 1.
Once done select inner join.
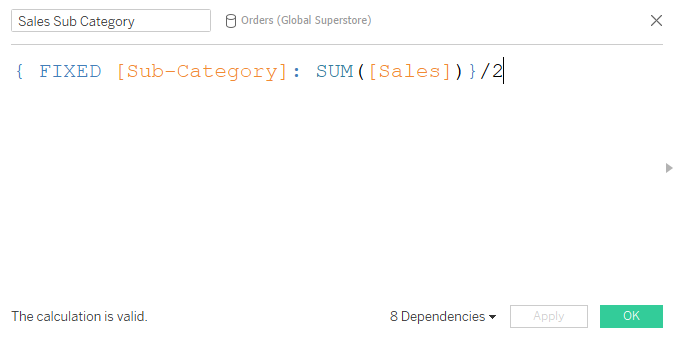
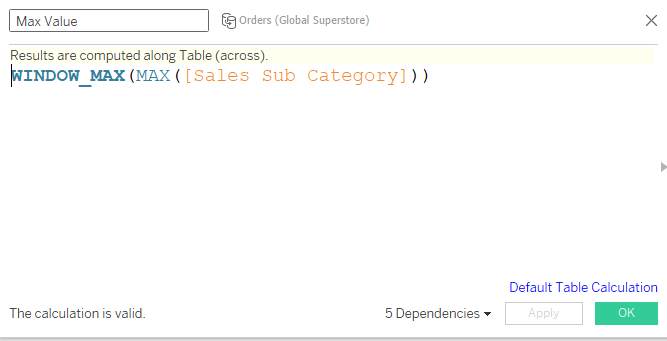
Step 3 : Go to a new sheet and create a calculation to calculate the sales across the sub-categories as under:
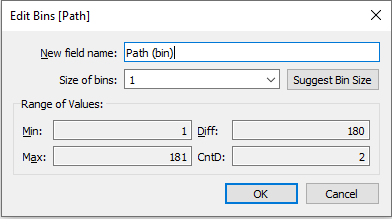
Step 4 : Right click on path and create Path bin. Make sure to keep the bin size as 1.
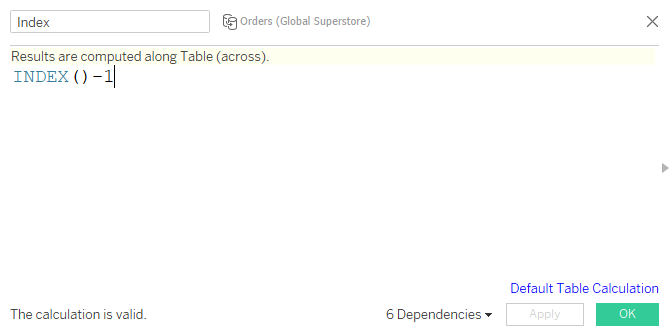
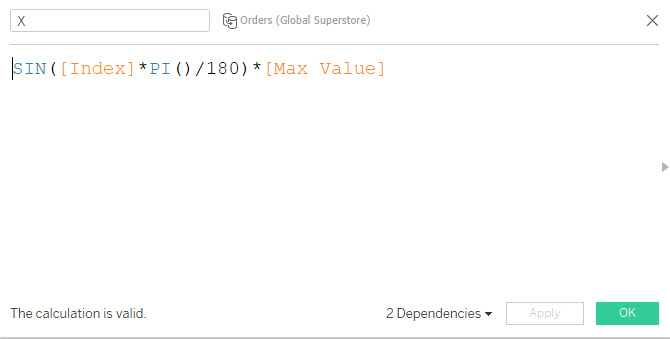
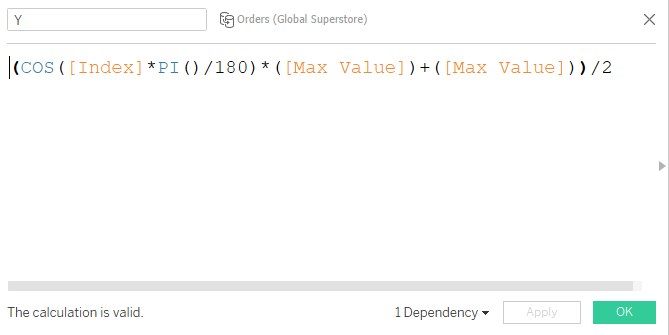
Step 5: Create the following calculation as under:
Step 6 : Select the mark type to be line. Drag path bin to rows , right click on it and click on show missing values. Then drag back Path bin to path and Drag sub Category to details.
Step 7 : Drag X to rows and Y to columns. Compute both of these with respect to path bin and there you go you have your arc charts ready.
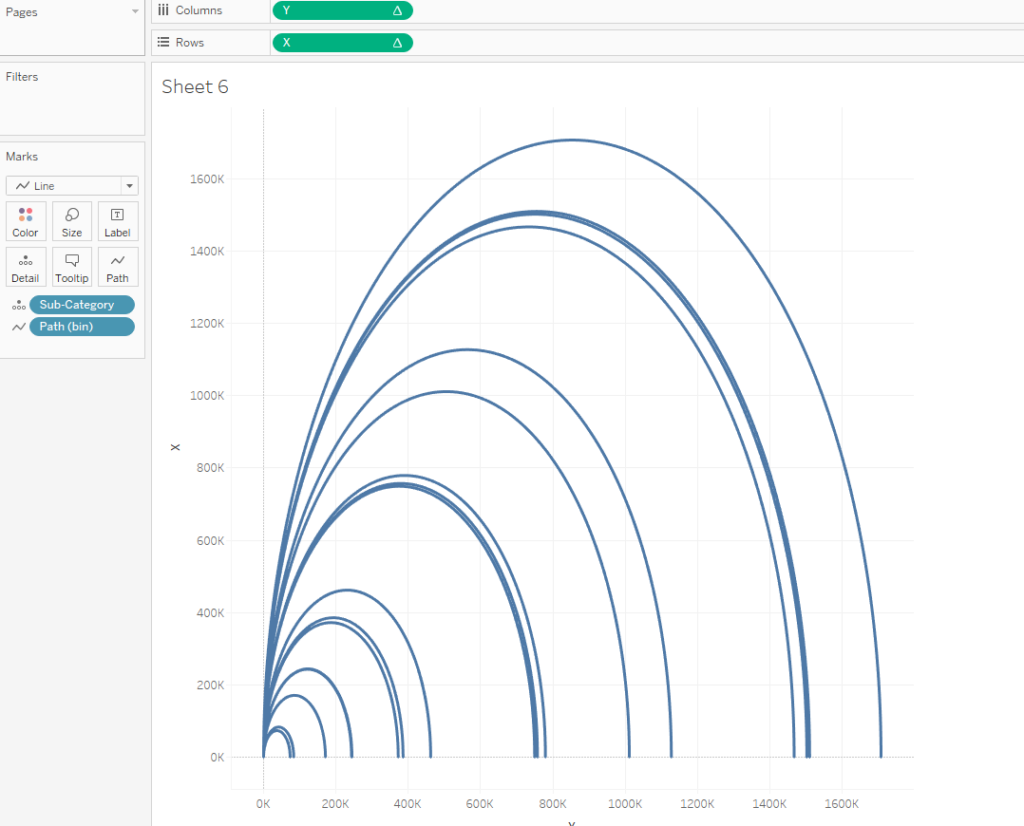
You can go ahead to format the chart and add labels to it.
Hope you guys enjoyed this tutorial.
In case if you have yet not subscribed to our newsletter please do so so that you get notified as soon as any new blog is posted .
Happy Learning!!