
Extracting Benefits of the Duo: Tableau and R
Tableau is one of the best business intelligence tools available in the market at present. It has been named a ‘Leader’ in Gartner Magic Quadrant fir six straight years in a row (Source – Tableau.com). I have been using Tableau for quite some time now and I seriously feel that it’s an amazing tool to create interactive and impactful visualizations with simple drag and drop. For Tableau, you need very minimal prior experience with coding, if at all you want to do complex calculations. Otherwise, most of the calculations and analysis happen with plain drag and drop. Moreover, Tableau can handle very large sums of data and can connect to multiple data sources. While, on one hand Tableau is an excellent visualization and BI tool, on the other hand, R is a very powerful statistical package which helps us in doing predictive analytics.
According to Wikipedia, “R is a programming language and free software environment for statistical computing and graphics that is supported by the R Foundation for Statistical Computing.” R Foundation is a not-for-profit organization working towards providing a support to R community and administering the copyright of R software and documentation. Since R is an open-source language, it has a very strong support of developer community. It has a vast library of packages ranging from linear regression models to complex models such as neural networks. Such a vast network of developers has helped R flourish to such a level in a short span of time. Packages available in R provide excellent ability to run and support different kinds of data sources, statistical techniques and tests, import/export capabilities, predictive modelling techniques, reporting tools, among others. Owing to such capabilities, many leading organizations in the technology industry such as Microsoft, Oracle, SAS, MATLAB, and many others have started providing integration support with R for their existing tools.
Tableau also started with R integration capabilities with its version Tableau 8.1 in 2013 and this improved the applications of Tableau to the next level. Though Tableau is a great visualization tool, there are certain areas such as statistical analysis, machine learning, predictive modeling and complex data manipulation where Tableau provides very minimal functionality. For all such reasons, it becomes important to provide connection to external tools such as R. Tableau and R, when integrated, provides excellent functionality to carry out most of the tasks listed above with ease.
Having talked enough about Tableau, R and the benefits they can provide when integrated, let’s move a step further and understand how we can take the advantage of integrating Tableau and R. After going through the article, you should be able to seek answers to following three questions.
- How to integrate Tableau and R?
- What are the functions used to run R scripts in Tableau?
- What are the limitations of Tableau and R integration?
- How to integrate Tableau and R?
There are five steps through which Tableau and R can be integrated. Let’s go through each of the steps and understand the integration.
- Run R and load the library RServe in RStudio

- Open Tableau and connect with R
Go to Help>>Setting and Performance>>Manage External Service Connection
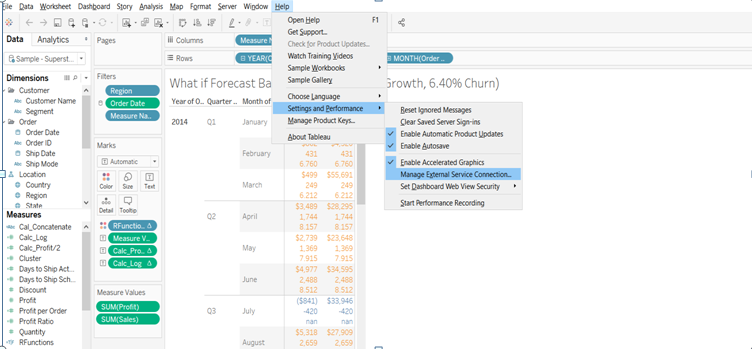
Once you click on ‘Manage External Service Connection’, a dialog box will appear as shown below.

Enter the Server name as localhost and Part as 6311. And, you are good to go. Start running R scripts in Tableau.
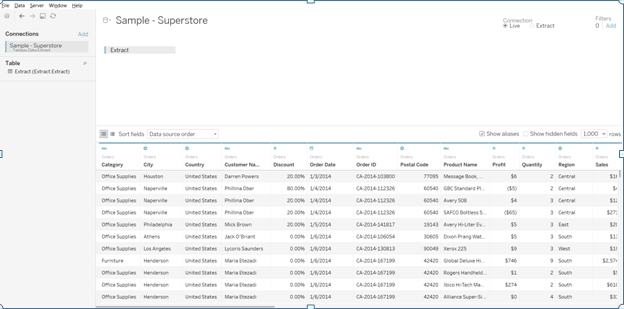
- Load data in Tableau
Here, we can connect to any external data source such as SQL server, DB2, SAP HANA, or flat files. In our example, we will use the default sample Tableau dashboard named ‘Sample – Superstore’. The calculation and charts used in the subsequent sections are from ‘What If Forecast’ sheet of Superstore Tableau dashboard.
- Run the R script
All the R scripts in Tableau are run through ‘Calculated Field.’
Go to Analysis>>Create Calculated Field
There are specific functions using which you can run R scripts in Tableau. We will discuss these functions in the subsequent sections.
Use the calculated fields in your analysis with existing dimensions and measures

The above 5 steps provide you a step by step approach to running R scripts in Tableau. Now, in the next section let’s understand how Tableau reads data from R.
- What are the functions used to run R scripts in Tableau?
There are four functions which are used to run R scripts in Tableau. The four functions are
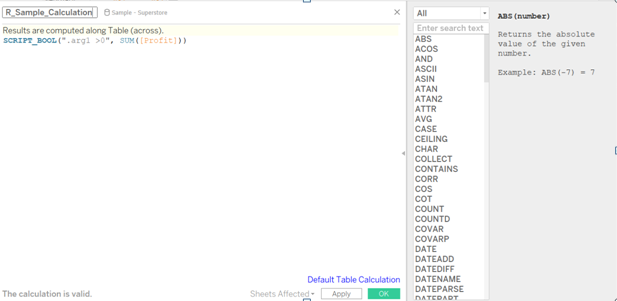
- SCRIPT_BOOL
- SCRIPT_INT
- SCRIPT_REAL
- SCRIPT_STR
Since R functions in Tableau are computed as table calculations, all the fields must be aggregated like SUM([Sales]), MIN([Sales]), MAX([SALES]), and so on.
Let’s run each of the functions in Tableau and check the results.
The expression to external service connection (R in this case) is passed through “Create Calculated Field.” In the R expression, use “.arg1”, “.arg2”,…, to reference parameters. In the above example, “.arg1” refers to field SUM([Profit]).
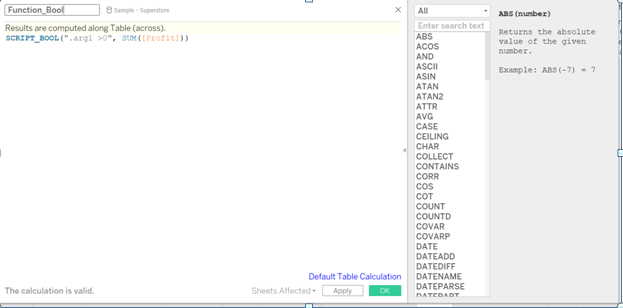
Once you create the calculated field, you will see the field name in Measures pane on the left side of Tableau screen. You can use calculated field for analysis with other dimensions and measures. In the below image, the calculated field – Function_Bool – gives us Boolean output (TRUE/FALSE) based on the condition set in the calculation field (Sum of profit for the case in discussion).

Now, let’s try the second function, SCRIPT_INT. SCRIPT_INT function returns integer values after doing calculations in R.
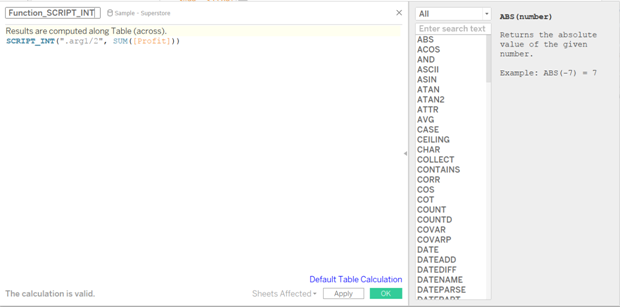
The above function returns integer value, which is half of SUM([Profit]).

In the above image, we have shown multiple values in the calculation. SUM([Profit]), (SUM([Profit])/2) are shown one below the other. The color indicates the Function_Bool (TRUE/FALSE) value calculated above.
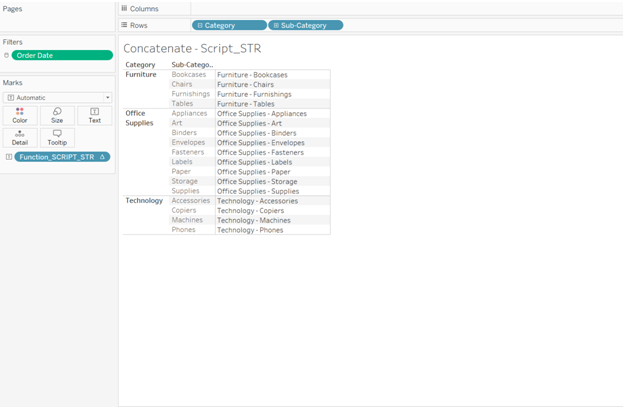
Let’s try another function – SCRIPT_STR; this function is used for text fields. We will try to concatenate two fields using SCRIPT_STR.

The output is as shown below.
I will leave the last function, SCRIPT_REAL, for you to try and check the results. SCRIPT_REAL is used where the output is real numbers. Try the example by taking Log of SUM([Profit]).
I am sure by now you must have realized the benefits provided by integrating Tableau with R. There are many more complex calculations which can be run in R and presented in Tableau. However, owing to the scope of this post, we are focusing only on the basics of Tableau and R integration in this article.
Having said and talked about all the advantages, there are certain limitations with this also. This brings us to the third question that we are seeking answer to in this article
3.What are the limitations of Tableau and R integration?
Users need to have Rserve connection configured on the desktop on which the file is being run. Also, users can’t publish Tableau workbooks containing R scripts to Tableau Public or view in Tableau Reader. In case you are using Tableau Server, you need to set up a connection between Tableau Server and R.
Having gone through the article, I am sure you will be able to set up a connection between Tableau and R, and start running R scripts to take the maximum benefit of the duo. We would be happy to hear your thoughts and experiences in the projects where you have used Tableau and R collectively.
Author Bio:
This article was contributed by Perceptive Analytics. Sinna Muthiah Meiyappan, Saneesh Veetil and Chaitanya Sagar contributed to this article.
Perceptive Analytics provides Tableau Consulting, data analytics, business intelligence and reporting services to e-commerce, retail, healthcare and pharmaceutical industries. Our client roster includes Fortune 500 and NYSE listed companies in the USA and India.