
I recently came across a dataset that had the viewers ratings of Netflix shows released by year. I did not go into the dataset to check its validity but assuming it to be valid I chose too deep dive into it and see what intersting information and insights could be drawn out from the data.
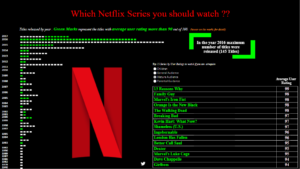
I tried to represent the show titles released in a year by a square mark and then classify the marks in two buckets : Green for the shows that had rating more than 90 out of 100 and White otherwise.
It was interesting to know that Netflix released maximum titles in 2016 ( 145 total ).
In my visualization I also included a filter which would give a user the top 15 shows in the Segment that he/she falls.
So go check out the top 15 shows according to your segment and watch them if you haven’t .
Check out this cool visualization here : Which Netflix Series to Watch
Thanks.
Rahul Singh