
Hi All,
This is a new blog series for Tableau in which we will be discussing how calculations work in tableau . This post covers the first three quick table calculations available in tableau . The remaining we would cover in the coming blogs under this series.
Today we will be talking about the following :
1- Running total
2- Difference
3- Percentage Difference
So lets start going and look into these each at one time.
To understand this we will have create a very basic report from our Superstore data in tableau that shows us the Sales of Sub Categories across years. This is done dragging Order Date into the Columns pill , Sub Category into the Rows and placing Sales into the text mark. This is what your screen should look like:
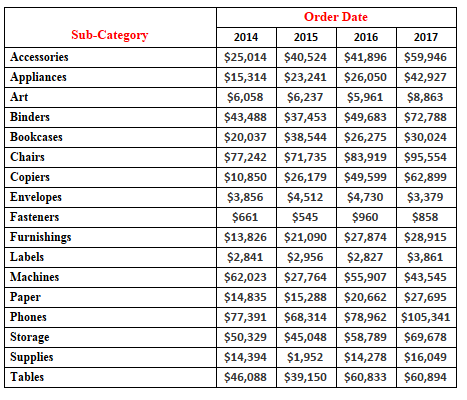
1-Running Total:
Lets suppose that we have a series 1 , 2 , 5 , 8 . The running total would add the previous entry to the sum . In this case the running total would be 1 , (1+2) , (1+2+5) , (1+2+5+8)
To add the running total calculation right click on the Sales measure in the marks card and select Running Total.
Notice what happens in our view. The view changes to the following :
Our table calculation Running total computes the sales as described in the example. The Sales value for 2014 is the same as it was earlier, 2015 sales value is now the sum of 2014 sales and 2015 sales , 2016 sales is the sum of sales of 2014,2015 and 2016 and the sales for year 2017 is the sum of sales for all the years. This is calculated the same way for all the subcategories. The running total is calculated for the years ie across the table.
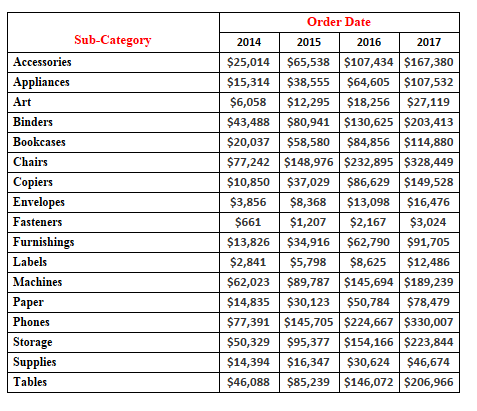
What if we want to calculate it down the table ie instead of summing across year our Running total should sum across the Sub Categories ? Tableau makes it very simple. Right Click on the Sales in the marks card and in the dropdown select compute using Table down. We now have our running sum being calculated across subcategories.Easy isn’t it ?
2- Difference:
Right click on our Sales measure and click on clear table calculation. This will remove our running sum calculation so that we can now use the other Calculations . Right click on the sum measure again and now select Difference . Your screen should now look somewhat like this :
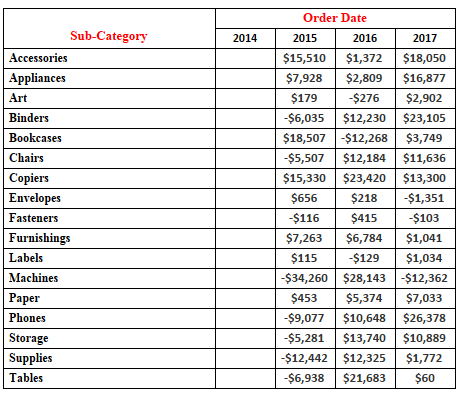
This calculates the difference in the sales with respect to the previous value . We have no values for 2014 as this is the first value in our view . The Value under 2015 is actually the difference between the Sales value for the year 2015 and 2014 . Similarly the value under 2016 is the difference between the Sales value of 2016 and 2015.
Here we notice that the difference is calculated with respect to the previous value in the table. Lets say we would like to calculate the difference wrt to the year 2014 for all the years . Doing this is easy in tableau . Simply right click on the sum measure in the marks card and in the dropdown select relative to >> first . Our job is done 🙂
There are other options as well that you can explore like first , last and next.
3- Percentage Difference :
The percentage difference calculation is similar to the Difference calculation , the only thing that changes is that here we have the difference represented in percentage form. Clear the earlier table calculation that we had for difference and now select the Percentage Difference from the dropdown. This is what you should be getting now :

Similar to the difference calculation we have the option of relative to for this in which we can specify the value by which the percentage difference is to be calculated.
Hope you all enjoyed this.Do let me know in case you are not able to follow any step.
In the next part we will discuss about Percent of Total , Rank and Percentile.
Thanks.
Rahul Singh