
Hi All,
Continuing to our discussion on Quick table calculation, today we will discuss about the remaining four calculations :
1- YTD Total
2-YTD Growth
3-Compound Growth Rate
4-Year over Year Growth Rate
To have a look into these calculations we will create a different table from the Superstore dataset. Bring the order date to the filters and select the year 2014.
Drag subcategory to the Rows Column and Order date to the Columns. In the columns pill click on the + sign that is on the Year pill. Doing this will give you another pill for Quarter in the Columns area along with year. Now bring sales to the text under marks column. The view should be something like this:

Now we have our table ready , lets look into what the remaining table calculation mean.
1- YTD Total:
Right click on the sales measure under the mark card, from the drop sown select Quick table calculation and then select YTD total. The view will now change to the following :

When we select YTD total , the function calculates a running total for the quarters across the subcategories. So the value for Q2 is the sum of Q1 and Q2. Similarly the value of Q3 is the sum of the first three quarters . The same is across all the subcategories.
2- YTD Growth :
YTD growth is an extension of YTD function . Instead of the running total this function calculates the % change in the value as respect to the previous value.
Clear the quick table calculation and now select YTD Growth from the Quick table calculations menu. Make sure the values are computed Table across. This is what our view looks like now:
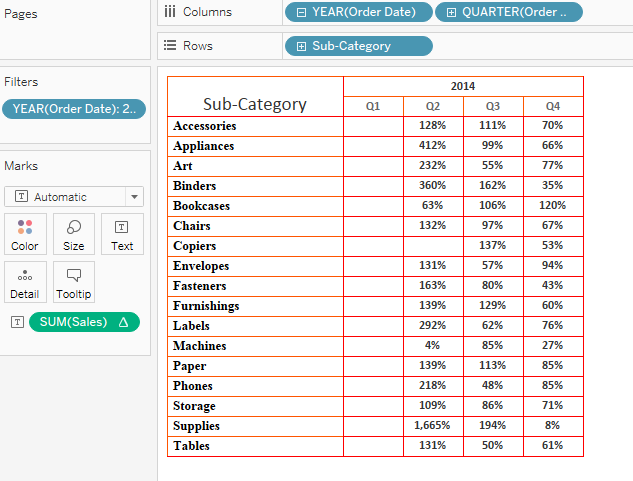
Lets try to understand how these values are calculated . If we refer to our previous calculation (YTD) for the subcategory Accessories we see that the value for Q2 id $6996 and that for Q1 is $3058 . If we calculate the percentage growth for these two we ((6996-3058)/3058) we get 128% . Similarly we get 111% as the growth rate when we see Q3 and Q2 for Accessories.
3- Compound Growth Rate:
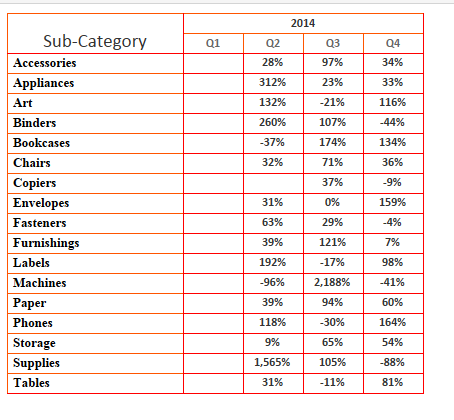
To calculate the compounded growth rate we calculate the geometric mean for the numbers. Lets say Product A has a growth rate of 15% and 17% respectively for two years. The compounded growth rate would be the geometric mean of these two. Lets see what we get from this when we select this and try to derive the number in view. Cleat the table calculation and select , Compound Growth rate in Quick table calculation. Make sure the value is computes across the table. Our result would be as under:
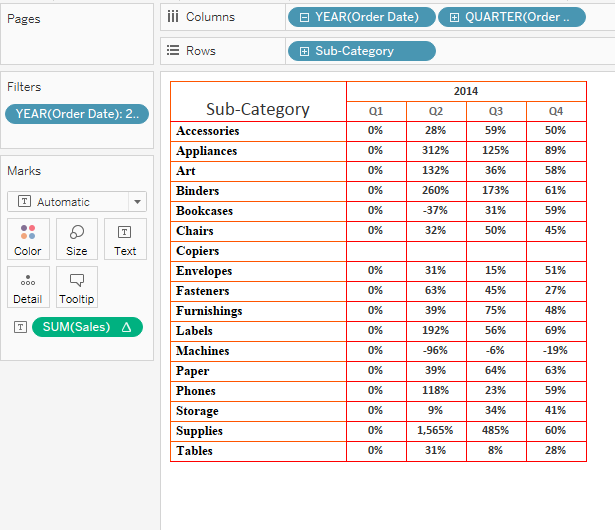
How did we get this value of 59% in Q3 for accessories ? To understand this we will have to look at Percentage difference first . When we select percentage difference from the quick table calculation our result is as under:
Now if we calculate the geometric mean for 28% and 97% we will get 59% . Similarly the geometric mean for 28%, 97% and 34% will be 50%.
4- Year Over Year Growth:
This works similar to percentage difference as we have already discusses in Part 1 of this series.
Hope you guys are now clear with all the quick table calculation available in Tableau . In case you fin any difficulty in these let me know. I will be glad to help.
With table calculations, you can calculate the \npercent change from an arbitrary value .