
Hi All,
In today’s tableau tip I will show you an effective way of changing the measures and dimensions in a chart using parameter.
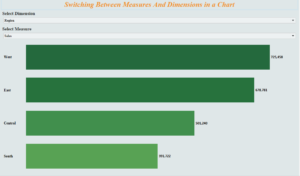
Consider the following scenario . You have a chart that shows profit across the Sub Categories in the Superstore data. Now we would like to bring Sales in measure and Region in Dimension. Instead of going to the worksheet and changing the measures and dimension we would control the measures and dimension of the chart in the dashboard using Parameters. The following image would make the context clear :
Here we see two dropdowns , one for the selection of dimension and other for the selection of Measure . The chart which has the current state of Profit across Sub Categories , would change the state with respect to the selection. For example if we select the Dimension to be Region and Measure to be Sales from the dropdown we would get the following :
So lets get started and try to create this with the help of parameters.
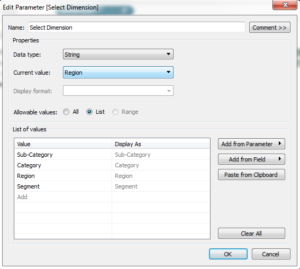
Step 1: Create a parameter “Select Dimension” for the selection of Dimension . We will consider Category , Sub-Category , Region and Segment in this case.
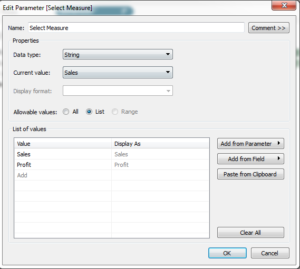
Step 2: Create a parameter “Select Measure” for the selection of Measure . We will consider the two measures Sales and Profit.
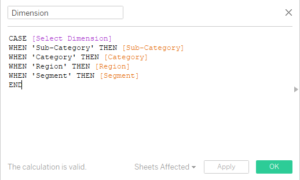
Step 3: Create a calculated field for Dimension that would pass the values of the dimension parameter when selected.
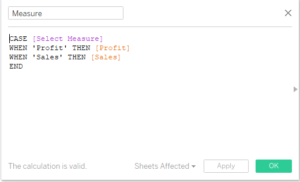
Step 4: Create a calculated field for Measure that will pass the value of the measure parameter when selected.
Drag Dimension to Rows and Measures to column . Click on the two parameters we have created and from the drop down select show parameter control. Now change the value of measure and dimension from the dropdown and your chart would update automatically.
Following is the link to the dashboard which demonstrates the example :Switching Charts
Hope you guys enjoyed it.
Do comment in case of any doubt .
Thanks.
Rahul Singh